
Background
Winnipeg is the capital and largest city of the Canadian province of Manitoba, home to more than 750,000 people spread across a wide, low-density urban footprint. In 2020, Professor Joyce Slater of the University of Manitoba set out to understand how that geography shaped what residents could actually eat.
Her team combined socioeconomic data — income, household size, vehicle access — with the locations of grocery stores, markets, and other food resources. The goal was to identify Winnipeg's food deserts: neighbourhoods where affordable, healthy food is genuinely hard to reach, and to make the health implications of that gap impossible to ignore.

The result was the Winnipeg Food Atlas — an interactive map that anyone, from a city councillor to a resident, could open and explore.
The problems Mango solved
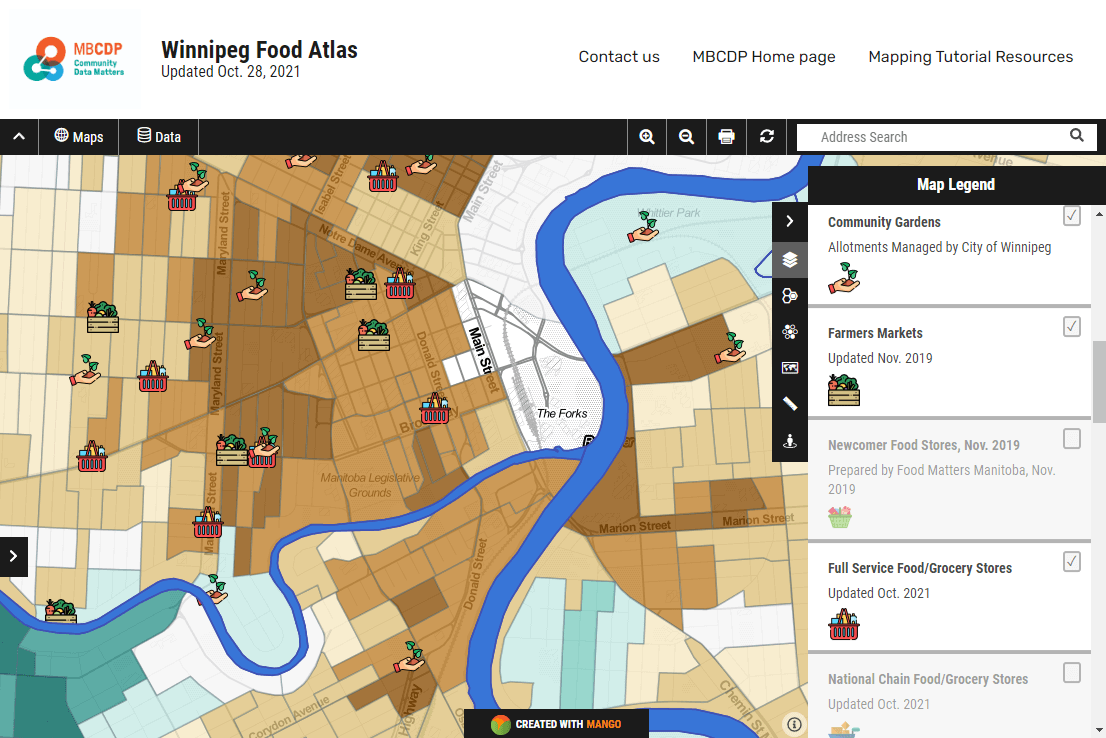
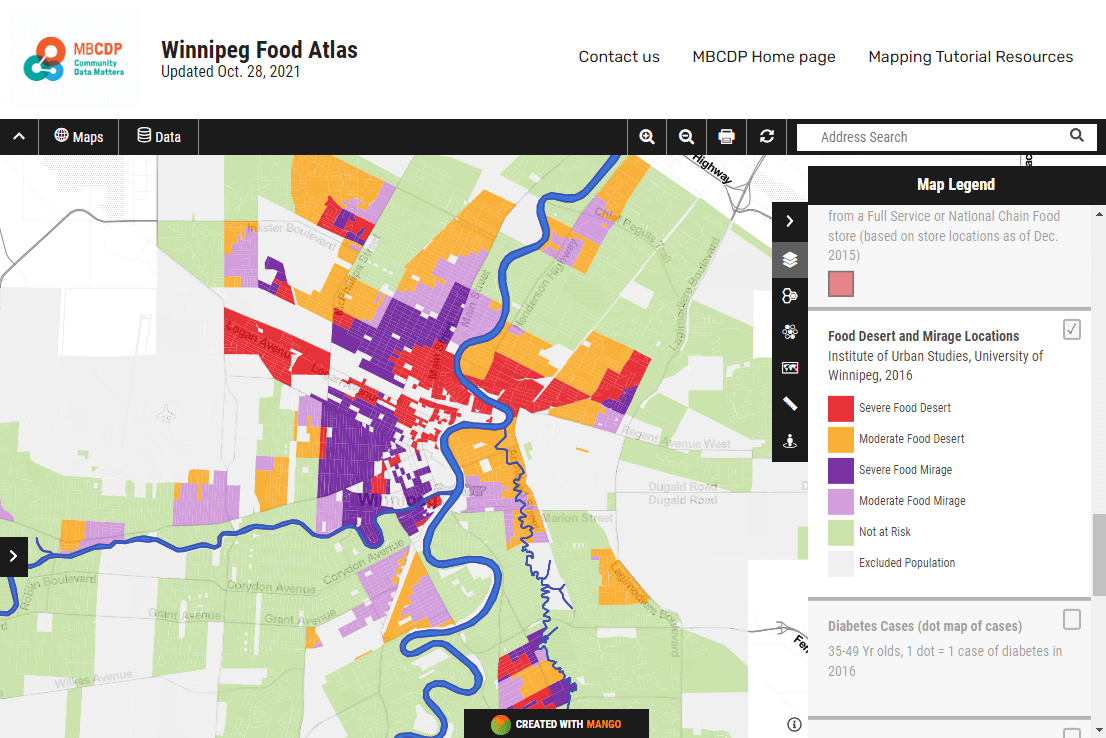
The research pulled together several datasets that had never lived on the same map before. Blending them — and then colour-coding the food deserts in red so the pattern jumped out — was exactly the kind of work that usually stalls in desktop GIS software and never reaches a public audience.
The number one challenge is there are too many people with not enough income or money to be able to afford healthy food.
Mango let the team publish the finished analysis to a link, without standing up a server or asking non-technical readers to install anything. The map did the explaining:
- Blended datasets — income, demographics, and food-resource locations on one map.
- Clear symbology — food deserts shaded red so the gaps read at a glance.
- Accessible to everyone — a shareable link that opened on any device, no GIS software required.
Results
The atlas drew national media attention and put hard numbers behind a problem that had been easy to talk around. The research linked food insecurity to lower nutritional scores and higher rates of diabetes — projecting more than $1 billion in potential downstream healthcare costs.
By publishing the work as a live map rather than a static report, the team turned a dense dataset into something a decision-maker could open, explore, and act on.