
Background
Based in São Paulo, Brazil, the Social Service of Commerce (SESC) works to improve the quality of life and well-being of workers and their families through sociocultural and educational programmes. One of its recent initiatives, Education for Sustainability, set out to do something a map rarely gets to do: teach a whole community about the environment on its own doorstep.
The project runs from the SESC Guarulhos site. Guarulhos is the second-most populous city in the state of São Paulo and the thirteenth largest in Brazil, home to roughly 1.4 million people — a place where questions of urban growth, water, and climate are anything but abstract.
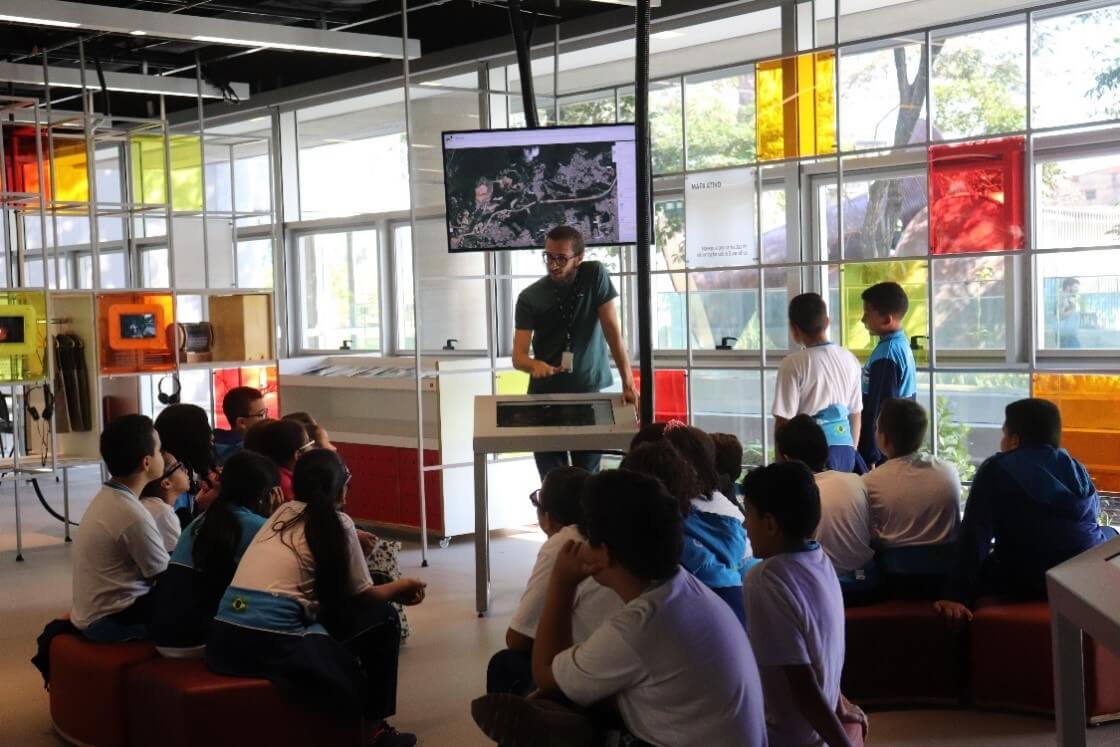
Alongside debates, courses, workshops, and guided tours, the site is a place to share what the community is learning about urban occupation, water resources, agroecology, waste reduction and recycling, composting, thermal islands, and climate change.
The problem Mango solved
At the heart of the initiative is a CEA technology project built around one idea: give visitors the autonomy to reach their own conclusions. Rather than being handed a finished report, people explore the data themselves and form their own view of what is happening in Guarulhos —
…with a view to contributing on the need for change, and the forms of individual and collective action to achieve it.
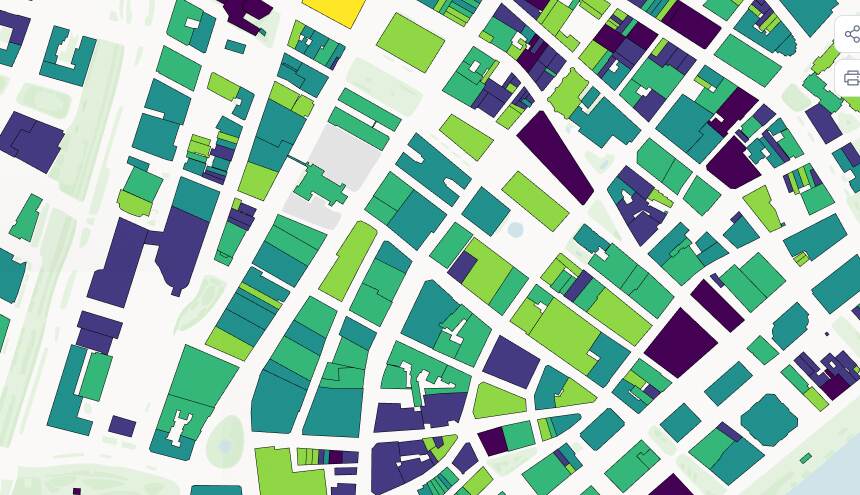
To make that possible, SESC needed an interactive map that non-technical visitors could pick up and explore at scale — urban occupation, water networks, and the local fauna and flora — inside a workshop setting. Mango gave them a fast, approachable way to turn georeferenced data on the Guarulhos area into exactly that, with no GIS software for visitors to learn.
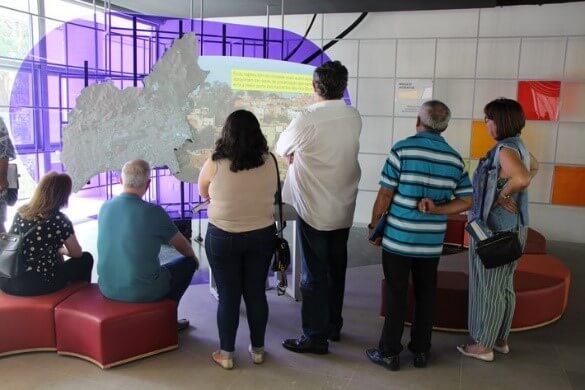
Photo: Lúcio Érico — Mapped Projection
Results
The finished map lets visitors zoom in and explore the specific areas, rivers, streets, and neighbourhoods they care about, and pull up the information behind each one. That turns a passive exhibit into an individual investigation: each person can follow the socio-environmental questions most relevant to where they live.
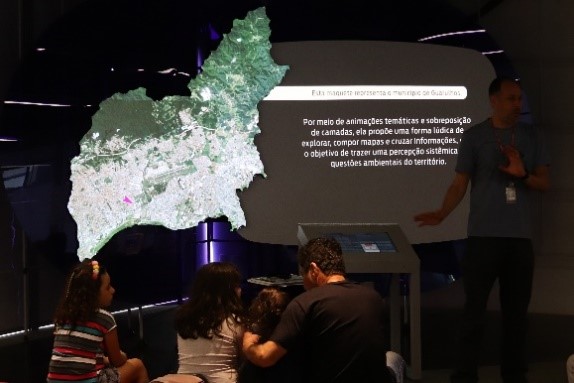
Photo: Alexandre Leopoldino — Mapped Projection
For a programme led by Denise Minichelli Marçon, of SESC's Education Management for Sustainability and Citizenship, the map became more than a visual aid — it became the space where the community's own insight about its environment takes shape.